Free AI Econ Graph Maker — Create Economics Graphs from Text
Describe an economic model, market scenario, or curve shift, and let AI turn it into a clean, editable economics graph. Create supply and demand graphs, PPF diagrams, aggregate demand and supply graphs, macroeconomics charts, and microeconomics visuals without drawing from scratch.
Try Econ Graph Maker
Générez votre diagramme immédiatement. Décrivez ce dont vous avez besoin.
Exemples rapides :

Current selected: FlowChart
Choisissez un type et entrez une description
Create Economics Graphs in 3 Steps
From economic explanation to editable visual diagram
Describe the Economic Scenario
Enter what you want to visualize, such as a supply curve shift, a demand increase, a production possibilities frontier, an inflation and GDP relationship, or an AS-AD model.
AI Generates the Econ Graph
The AI econ graph maker converts your prompt into a structured economic diagram with labeled axes, curves, equilibrium points, shifts, and annotations where needed.
Edit, Refine & Export
Adjust labels, rename curves, add explanations, change the scenario, or refine the layout through chat, then export your economics graph as PNG, SVG, or PDF.
Aucune inscription requise · Aucune carte bancaire nécessaire · Créez un diagramme de flux gratuit en quelques secondes
Econ Graph Maker Features
Everything you need to turn economics concepts into clear visual graphs
- Text to Economics Graph
- Generate economic graphs from plain language prompts. Describe the model or market condition, and AI will create a clear visual diagram automatically.
- Supply and Demand Graph Maker
- Create supply and demand graphs with price, quantity, demand curves, supply curves, equilibrium points, and curve shifts for market analysis or classroom use.
- PPF Graph Generator
- Build production possibilities frontier graphs to explain scarcity, opportunity cost, trade-offs, efficiency, inefficiency, and economic growth.
- Aggregate Demand and Supply Graphs
- Visualize macroeconomic models such as AD-AS graphs, short-run aggregate supply, long-run aggregate supply, price level, real GDP, and policy effects.
Econ Graph Maker FAQs
- What is an AI econ graph maker?
An AI econ graph maker is a tool that turns plain text descriptions of economic concepts into visual graphs. You can describe supply and demand, PPF, AS-AD, market equilibrium, curve shifts, or other economics models, and the AI generates a clean diagram for you.
- Can I create a supply and demand graph online?
Yes. You can use the tool as a supply and demand graph maker to create demand curves, supply curves, price and quantity axes, equilibrium points, and shifts caused by changes in demand or supply.
- Can I make a PPF graph with this tool?
Yes. You can generate PPF graphs, also called production possibilities frontier graphs, to show trade-offs, opportunity cost, efficient production points, inefficient points, and economic growth.
- Does it support aggregate demand and aggregate supply graphs?
Yes. You can create aggregate demand and supply graphs, including AD curves, SRAS curves, LRAS lines, real GDP labels, price level labels, equilibrium points, and policy or shock effects.
- Is this useful for economics students?
Yes. Students can use it to quickly create economics graphs for homework, study notes, presentations, and exam review. It is especially useful when you understand the concept but do not want to draw the graph manually.
- Can teachers use it to create classroom materials?
Yes. Teachers can generate editable economics diagrams for lectures, worksheets, slides, examples, and classroom explanations, then refine the labels and annotations as needed.
- Can I edit the economics graph after it is generated?
Yes. You can refine the graph through chat by asking the AI to rename curves, add shift arrows, update labels, mark equilibrium points, simplify the layout, or change the economic scenario.
- What types of economics graphs can I create?
You can create supply and demand graphs, PPF graphs, AD-AS graphs, market equilibrium diagrams, elasticity diagrams, price ceiling and price floor diagrams, GDP and inflation visuals, and other microeconomics or macroeconomics graphs.
Cas d’usage associés
Explorez des scénarios similaires
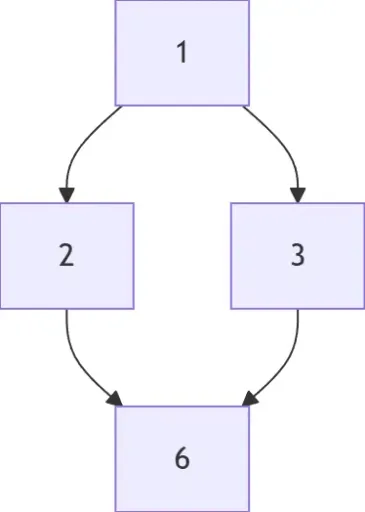
Flowchart Maker
Generate clean, editable flowcharts with AI. Describe any process in plain text and instantly turn it into a structured, professional diagram.
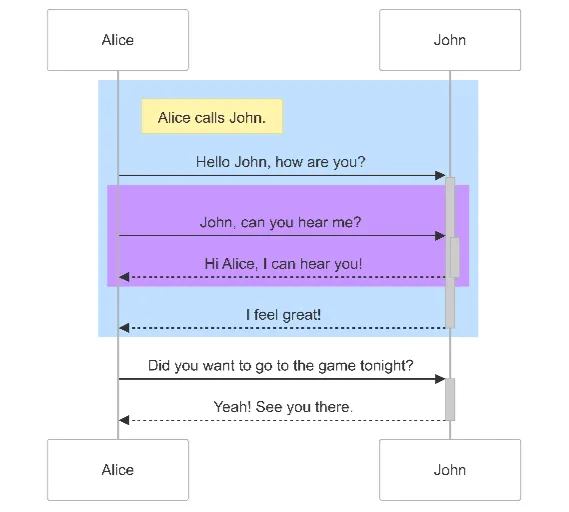
Sequence Diagram Maker
Generate UML sequence diagrams with AI to visualize how components, services, or systems interact over time.
Hasse Diagram Generator
Generate Hasse diagrams from any partially ordered set (poset). Perfect for mathematics, discrete structures, logic, and computer science.