Create Quadrant Charts with AI
Describe your items and evaluation criteria, and AI instantly produces a 2×2 quadrant chart—perfect for prioritization, portfolio analysis, and strategic planning.
Try Quadrant Chart Maker
أنشئ المخطط فورًا — أدخل وصفًا وسيقوم الذكاء الاصطناعي بالباقي.
أمثلة سريعة:

Current selected: Quadrant Chart
اختر نوع المخطط وأدخل وصفًا
Create Quadrant Charts in 3 Steps
From decision criteria to strategic insights
Define Axes
Choose the two dimensions you want to analyze—for example: Impact/Effort, Value/Cost, Risk/Reward, or Urgency/Importance.
Plot Items
List your items and assign each one a position along both axes. AI maps them into the appropriate quadrant.
Make Decisions
Use the resulting chart to prioritize, allocate resources, or identify high-value opportunities.
لا يتطلب تسجيلًا · لا حاجة لبطاقة ائتمان · أنشئ مخططًا انسيابيًا مجانيًا خلال ثوانٍ
Quadrant Chart Features
A strategic tool for product and business decisions
- Eisenhower Matrix
- Visualize urgency vs. importance to plan tasks and responsibilities.
- Value vs Effort
- Quickly identify low-effort, high-impact opportunities and deprioritize low-value work.
- Risk Assessment
- Plot risks by probability and impact to highlight areas requiring mitigation.
- Portfolio Analysis
- Evaluate products, features, investments, or opportunities through a 2×2 strategic lens.
Quadrant Chart Maker FAQs
- Which frameworks work well with quadrant charts?
Eisenhower Matrix, Value/Effort, Impact/Feasibility, RICE scoring, Risk Matrix, BCG Matrix, and many more strategic decision models.
- How do I score items objectively?
Use real metrics whenever possible—customer demand, revenue potential, engineering effort, or impact scores. For subjective items, scoring rubrics or team voting works well.
- What if I have too many items?
Prioritize the top 10–20 items or create themed versions of the quadrant (e.g., by team or category). Overcrowded charts reduce clarity.
أمثلة مشابهة
اكتشف أمثلة استخدام ذات صلة
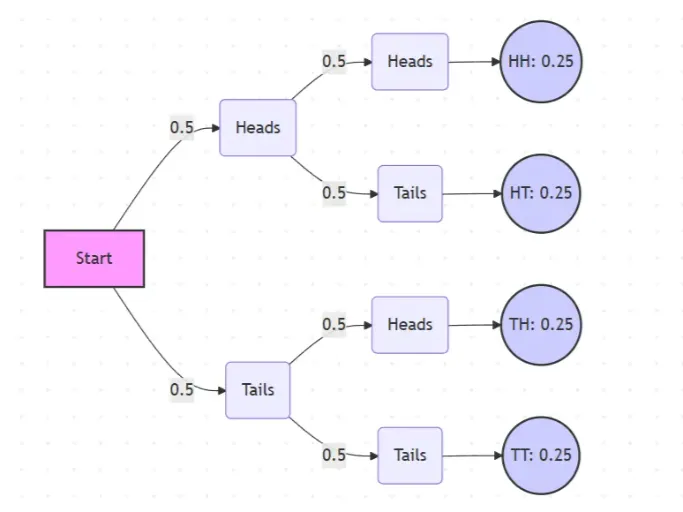
Probability Tree Diagram Generator
Create a probability tree diagram online to visualize conditional probability, dependent events, and multi-step outcomes. Use it as a probability tree diagram calculator for examples, exams, and real-world problems.
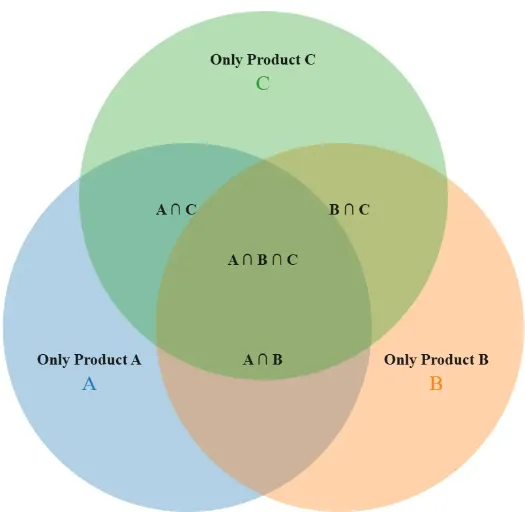
Venn Diagram Maker
Create Venn diagrams online with an easy-to-use Venn diagram maker. Generate 2, 3, 4, or more circle Venn diagrams for math, statistics, probability, and data visualization — free and online.
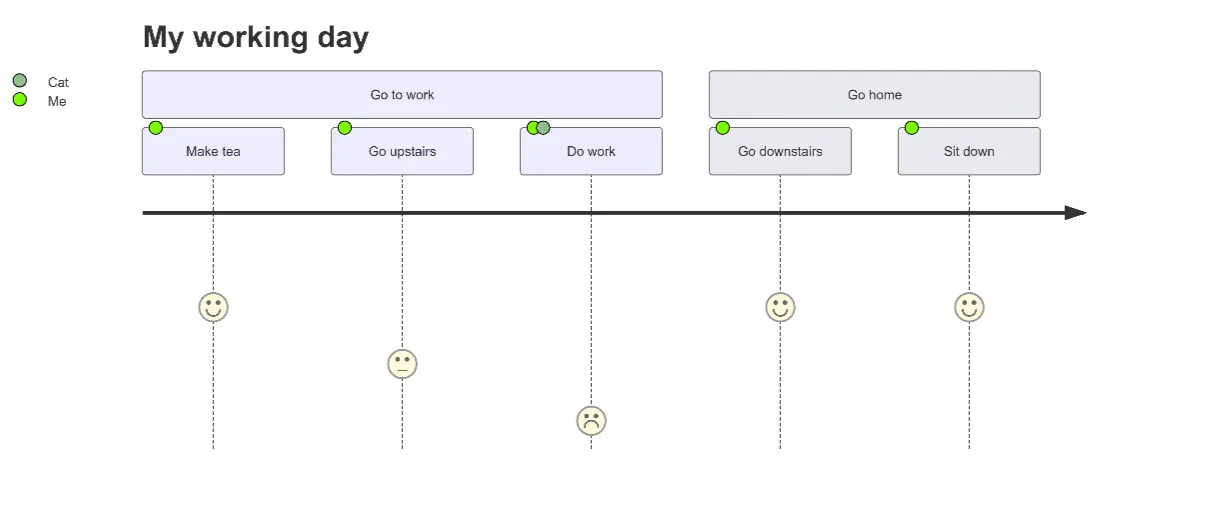
User Journey Map Maker
Generate clear, structured customer journey maps with AI. Visualize touchpoints, emotions, pain points, and satisfaction across the entire experience.