Create Customer Journey Maps with AI
Describe customer interactions—from awareness to purchase to retention—and AI produces a structured journey map highlighting emotions, touchpoints, and improvement opportunities.
Try Customer Experience Journey
Erstellen Sie Ihr Diagramm sofort mit KI. Geben Sie einfach eine Beschreibung ein.
Beispiele:

Current selected: User Journey
Diagrammtyp wählen und Beschreibung eingeben
Map Experiences in 3 Steps
Understand your customer’s perspective visually
Define Journey Stages
List customer behaviors, motivations, expectations, and interactions across each stage.
AI Creates Journey Map
AI generates a journey visualization showing user emotions, satisfaction levels, and moments of truth.
Improve Experience
Identify friction points, unmet needs, and opportunities to refine the customer experience.
Keine Registrierung erforderlich · Keine Kreditkarte nötig · In Sekunden ein kostenloses Flowchart erstellen
Customer Experience Tools
Visualize user behavior from start to finish
- Touchpoint Mapping
- Show every interaction point between the customer and your product, service, or brand.
- Satisfaction Scoring
- Color-coded experience levels help teams understand emotional highs and lows.
- Multi-Actor Journeys
- Include interactions involving customers, support teams, sales, product, or automated systems.
- Pain Point Identification
- Spot key drop-offs or negative experiences requiring attention.
Customer Journey FAQs
- How do I determine satisfaction scores?
Use data from surveys, customer interviews, support logs, behavioral analytics, or usability tests.
- Can I map B2B journeys?
Yes. B2B journeys often include multiple touchpoints across different roles—decision-makers, influencers, and end users.
- How detailed should each touchpoint be?
Focus on meaningful interactions that influence perception or decision-making. Avoid cluttering with overly granular steps.
- Can I map multiple personas?
Yes, but separate diagrams for each persona often provide clearer insights.
- How often should journey maps be updated?
Update regularly as your product evolves, new channels are added, or customer expectations change.
Ähnliche Use-Cases
Weitere verwandte Diagramme entdecken
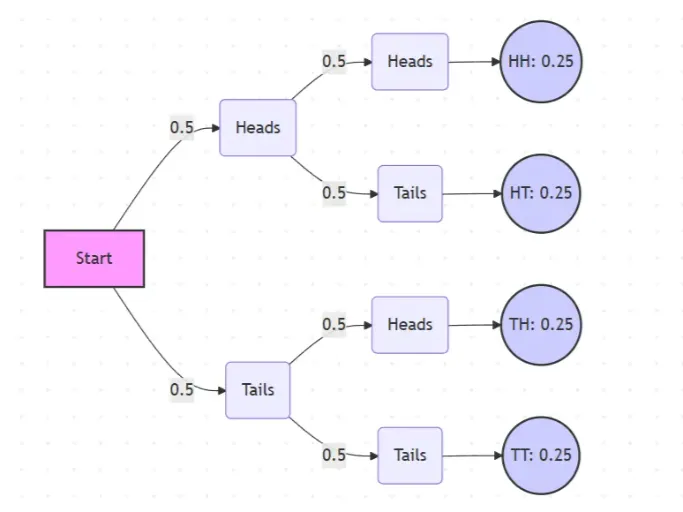
Probability Tree Diagram Generator
Create a probability tree diagram online to visualize conditional probability, dependent events, and multi-step outcomes. Use it as a probability tree diagram calculator for examples, exams, and real-world problems.
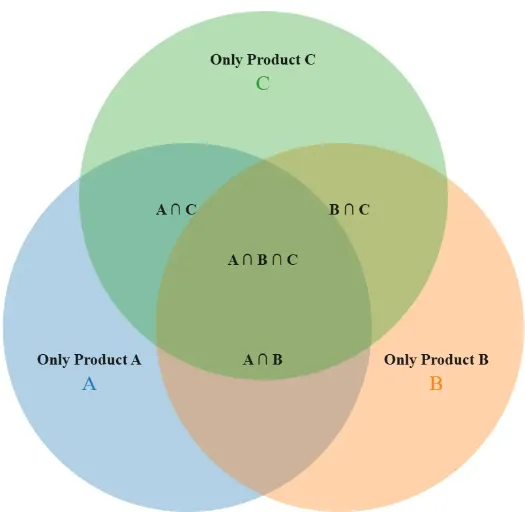
Venn Diagram Maker
Create Venn diagrams online with an easy-to-use Venn diagram maker. Generate 2, 3, 4, or more circle Venn diagrams for math, statistics, probability, and data visualization — free and online.
User Journey Map Maker
Generate clear, structured customer journey maps with AI. Visualize touchpoints, emotions, pain points, and satisfaction across the entire experience.