Create User Onboarding State Diagrams with AI
Describe your onboarding journey—registration, profile completion, verification, activation milestones—and AI converts it into a structured state machine diagram.
Try User Onboarding States
Erstellen Sie Ihr Diagramm sofort mit KI. Geben Sie einfach eine Beschreibung ein.
Beispiele:

Current selected: State Diagram
Diagrammtyp wählen und Beschreibung eingeben
Design Onboarding in 3 Steps
Make user activation paths clear and measurable
Map Onboarding Steps
List the stages users go through—signup, verification, tutorials, feature discovery, activation.
AI Builds State Machine
AI generates a diagram showing onboarding progress, completion states, branching paths, and fallback scenarios.
Optimize Conversion
Identify friction points, drop-off states, and opportunities to shorten time-to-value.
Keine Registrierung erforderlich · Keine Kreditkarte nötig · In Sekunden ein kostenloses Flowchart erstellen
User Activation Features
Visualize how users progress toward meaningful activation
- Multi-Step Onboarding
- Model onboarding sequences that span multiple steps, screens, or tasks.
- Verification Workflows
- Include email, phone, KYC, or identity verification states.
- Feature Discovery
- Show tutorial flows, guided tours, or progressive feature unlocks.
- Activation Triggers
- Highlight key moments where users experience value for the first time.
User Onboarding State FAQs
- How do I model optional vs required onboarding steps?
Specify which actions are mandatory and which are optional. AI will differentiate required flows from secondary enhancement paths.
- Can I show different paths for different user types?
Yes. AI supports branching logic for user roles, subscription levels, goals, or personas.
- How do I handle onboarding that spans multiple sessions?
Include persistent states such as 'in_progress' and describe resume logic for returning users.
- Can I add post-onboarding engagement states?
Yes. Extend your diagram with states like 'exploring_features', 'active_user', 'at_risk', etc.
- How do I optimize conversion based on the state machine?
Identify states with high exit transitions and reorganize steps to shorten and simplify the path to activation.
Ähnliche Use-Cases
Weitere verwandte Diagramme entdecken
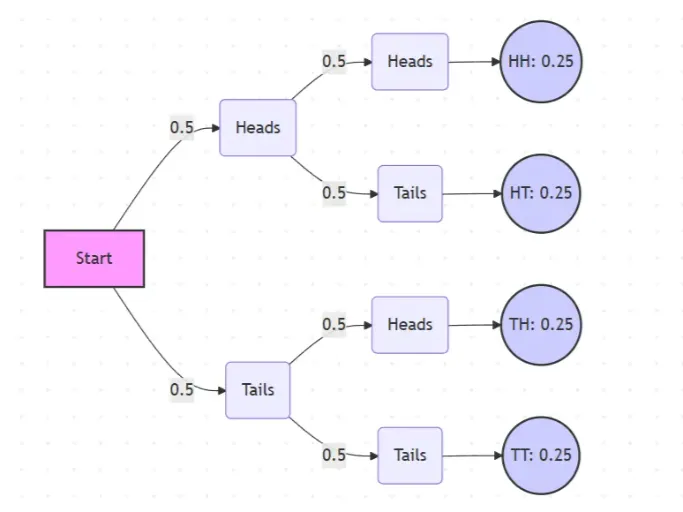
Probability Tree Diagram Generator
Create a probability tree diagram online to visualize conditional probability, dependent events, and multi-step outcomes. Use it as a probability tree diagram calculator for examples, exams, and real-world problems.
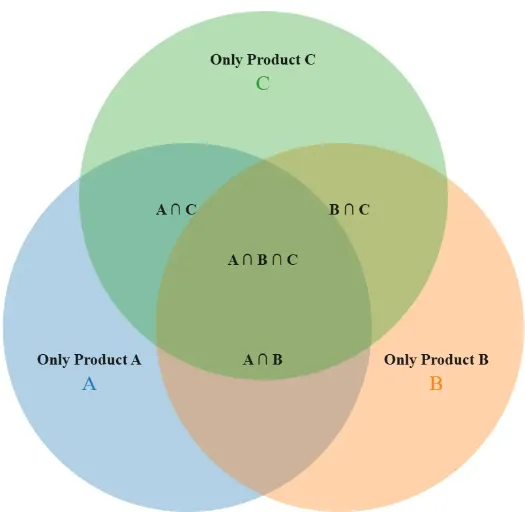
Venn Diagram Maker
Create Venn diagrams online with an easy-to-use Venn diagram maker. Generate 2, 3, 4, or more circle Venn diagrams for math, statistics, probability, and data visualization — free and online.
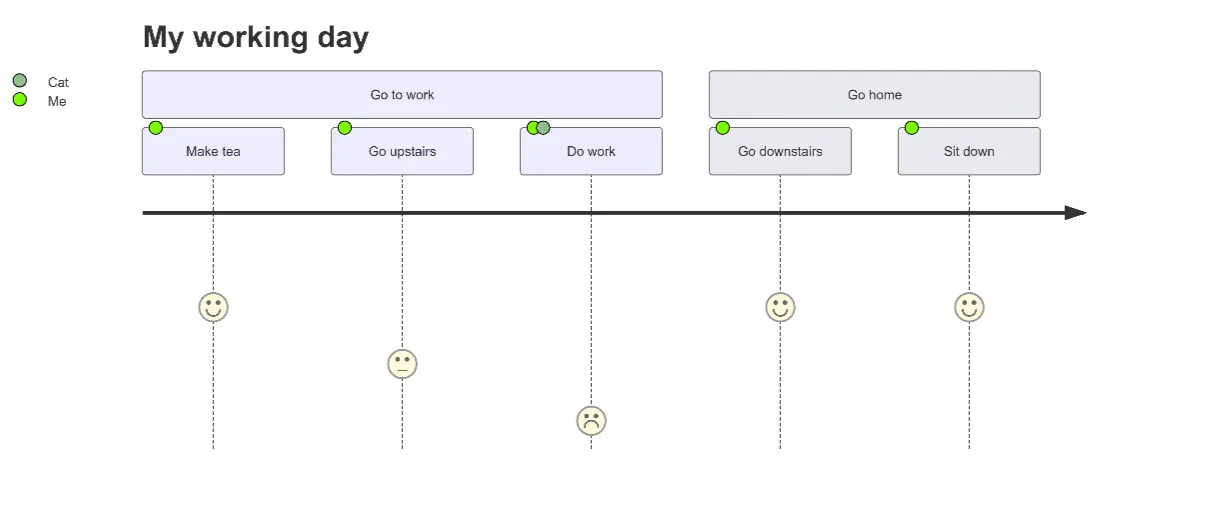
User Journey Map Maker
Generate clear, structured customer journey maps with AI. Visualize touchpoints, emotions, pain points, and satisfaction across the entire experience.