Create Customer Journey Maps with AI
Describe customer interactions—from awareness to purchase to retention—and AI produces a structured journey map highlighting emotions, touchpoints, and improvement opportunities.
Try Customer Experience Journey
Générez votre diagramme immédiatement. Décrivez ce dont vous avez besoin.
Exemples rapides :

Current selected: User Journey
Choisissez un type et entrez une description
Map Experiences in 3 Steps
Understand your customer’s perspective visually
Define Journey Stages
List customer behaviors, motivations, expectations, and interactions across each stage.
AI Creates Journey Map
AI generates a journey visualization showing user emotions, satisfaction levels, and moments of truth.
Improve Experience
Identify friction points, unmet needs, and opportunities to refine the customer experience.
Aucune inscription requise · Aucune carte bancaire nécessaire · Créez un diagramme de flux gratuit en quelques secondes
Customer Experience Tools
Visualize user behavior from start to finish
- Touchpoint Mapping
- Show every interaction point between the customer and your product, service, or brand.
- Satisfaction Scoring
- Color-coded experience levels help teams understand emotional highs and lows.
- Multi-Actor Journeys
- Include interactions involving customers, support teams, sales, product, or automated systems.
- Pain Point Identification
- Spot key drop-offs or negative experiences requiring attention.
Customer Journey FAQs
- How do I determine satisfaction scores?
Use data from surveys, customer interviews, support logs, behavioral analytics, or usability tests.
- Can I map B2B journeys?
Yes. B2B journeys often include multiple touchpoints across different roles—decision-makers, influencers, and end users.
- How detailed should each touchpoint be?
Focus on meaningful interactions that influence perception or decision-making. Avoid cluttering with overly granular steps.
- Can I map multiple personas?
Yes, but separate diagrams for each persona often provide clearer insights.
- How often should journey maps be updated?
Update regularly as your product evolves, new channels are added, or customer expectations change.
Cas d’usage associés
Explorez des scénarios similaires
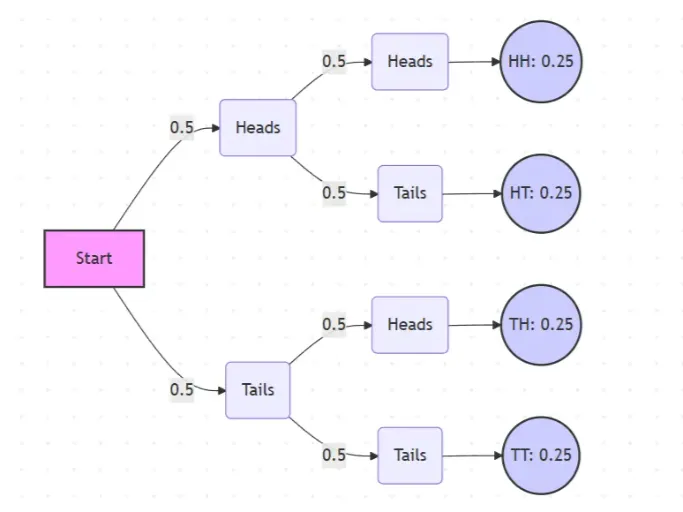
Probability Tree Diagram Generator
Create a probability tree diagram online to visualize conditional probability, dependent events, and multi-step outcomes. Use it as a probability tree diagram calculator for examples, exams, and real-world problems.
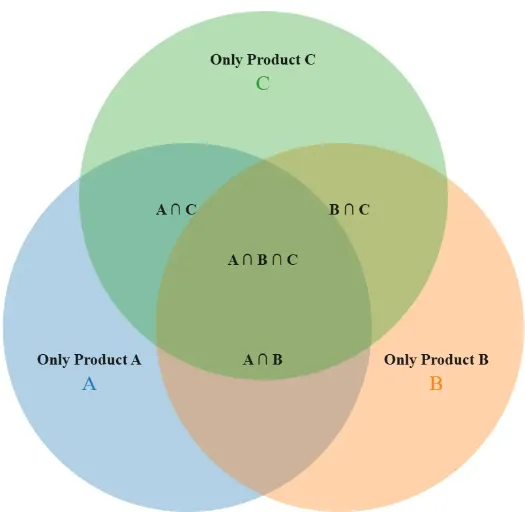
Venn Diagram Maker
Create Venn diagrams online with an easy-to-use Venn diagram maker. Generate 2, 3, 4, or more circle Venn diagrams for math, statistics, probability, and data visualization — free and online.
User Journey Map Maker
Generate clear, structured customer journey maps with AI. Visualize touchpoints, emotions, pain points, and satisfaction across the entire experience.