Create Feature Prioritization Matrices with AI
List your features and evaluation criteria—impact, effort, value, cost—and AI instantly generates a 2×2 or scored prioritization matrix to guide product decisions.
Try Feature Prioritization Matrix
AIで図表を即時生成。まずは説明を入力してください。
クイック例:

Current selected: Quadrant Chart
図表タイプを選び、説明文を入力してください
Prioritize Features in 3 Steps
Transform complex decisions into a visual matrix
List Features & Criteria
Provide your features along with scores or qualitative ratings for impact, effort, risk, or value.
AI Builds the Matrix
AI creates a prioritization chart—Impact vs Effort, Value vs Cost, RICE, or any custom scoring model.
Decide What to Build
Use the matrix to identify high-impact, low-effort items and align your roadmap accordingly.
登録不要 · クレジットカード不要 · 数秒で無料フローチャート作成
Built for Product Teams
Make smarter decisions with data-backed visuals
- Impact vs Effort Matrix
- Identify quick wins, big bets, fill-ins, and time sinks with a classic 2×2 matrix.
- Value vs Cost
- Understand which investments create maximum customer or business value.
- RICE Scoring
- Use Reach, Impact, Confidence, and Effort to prioritize complex initiatives.
- Feature Comparison
- Compare dozens of ideas visually to uncover hidden opportunities.
Feature Prioritization FAQs
- Which prioritization model should I use?
Use Impact/Effort for simplicity, Value/Cost for business-oriented decisions, or RICE for detailed roadmap planning.
- How many features can I include?
A matrix is clearest with 10–20 features, but AI can visualize larger sets as well.
- Can I customize the axes?
Yes. Choose any two criteria—risk, urgency, cost, impact, satisfaction, effort—and AI will build the corresponding matrix.
- Can I generate multiple matrices?
Yes. Many teams compare multiple models before finalizing prioritization.
- Is this useful for leadership reviews?
Absolutely. Matrices simplify communication and reduce subjective debate.
関連ユースケース
似たユースケースを探す
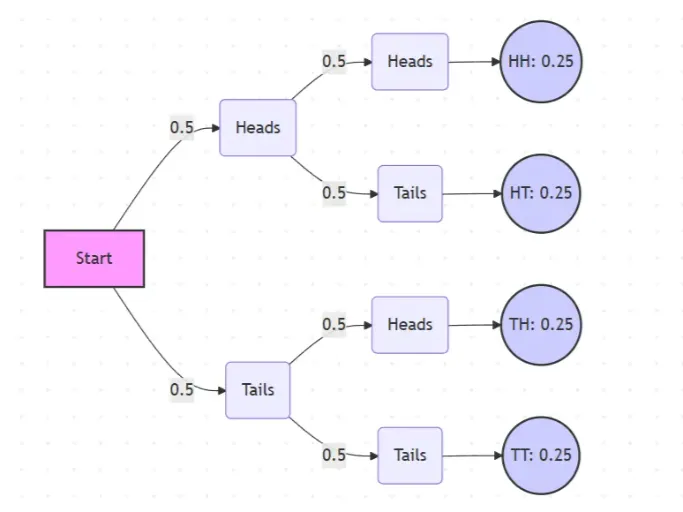
Probability Tree Diagram Generator
Create a probability tree diagram online to visualize conditional probability, dependent events, and multi-step outcomes. Use it as a probability tree diagram calculator for examples, exams, and real-world problems.
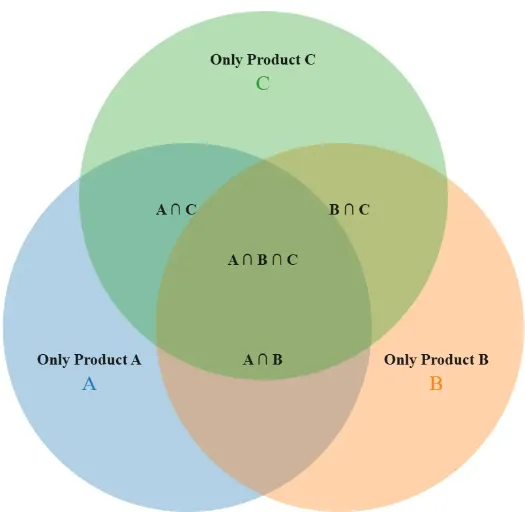
Venn Diagram Maker
Create Venn diagrams online with an easy-to-use Venn diagram maker. Generate 2, 3, 4, or more circle Venn diagrams for math, statistics, probability, and data visualization — free and online.
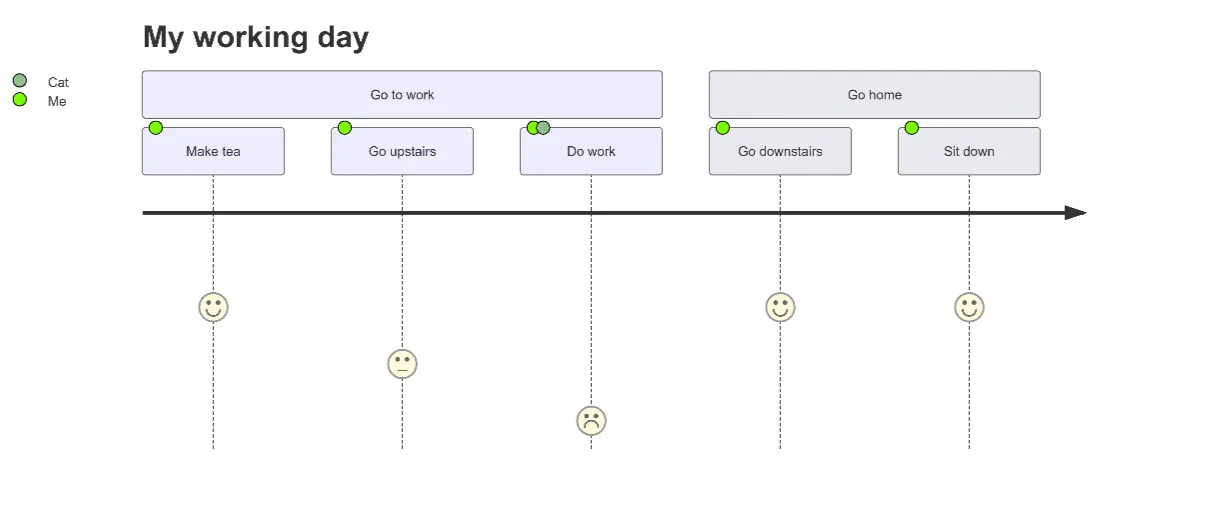
User Journey Map Maker
Generate clear, structured customer journey maps with AI. Visualize touchpoints, emotions, pain points, and satisfaction across the entire experience.