Create Timeline Charts with AI
List your milestones—company growth, project phases, historical events—and AI instantly transforms them into a polished timeline that’s easy to read and presentation-ready.
Try Timeline Chart Maker
AIで図表を即時生成。まずは説明を入力してください。
クイック例:

Current selected: Timeline
図表タイプを選び、説明文を入力してください
Create Timelines in 3 Steps
From event listing to chronological visualization
List Events
Describe key dates, milestones, achievements, or phases of your project or organization.
AI Generates Timeline
AI arranges your events in chronological order with clear visual spacing and labels.
Share Your Story
Export your timeline for pitch decks, websites, reports, or internal documentation.
登録不要 · クレジットカード不要 · 数秒で無料フローチャート作成
Timeline Features
Professional chronological visualization without manual design
- Chronological Organization
- Events are automatically sorted and spaced for easy comprehension.
- Multiple Events Per Period
- Show several milestones within the same timeframe using layered or grouped labels.
- Company History
- Perfect for outlining founding milestones, product launches, growth phases, and achievements.
- Project Phases
- Visualize roadmaps, development cycles, and phased deliverables clearly.
Timeline Chart Maker FAQs
- What can I visualize with timelines?
Company histories, product roadmaps, project timelines, marketing campaigns, historical sequences, event logs, or personal career paths.
- Can I include future planned events?
Yes. Simply describe upcoming milestones and AI will place them appropriately with optional 'planned' or 'future' labeling.
- How detailed should my timeline be?
Include major milestones and those relevant to your audience. Avoid cluttering with too many minor events unless necessary for documentation.
関連ユースケース
似たユースケースを探す
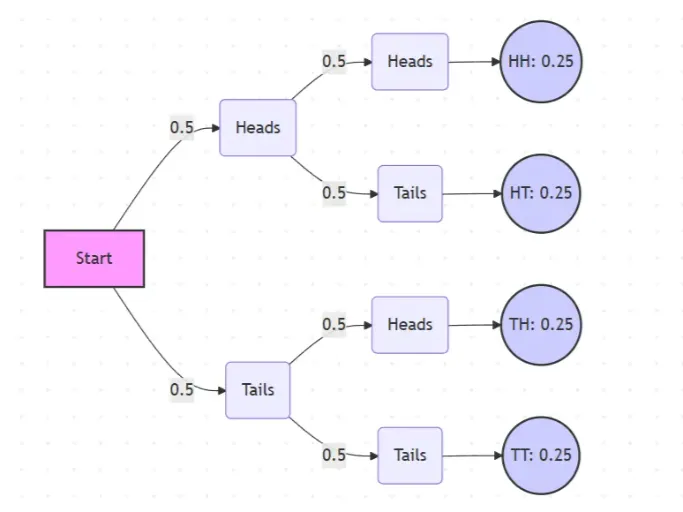
Probability Tree Diagram Generator
Create a probability tree diagram online to visualize conditional probability, dependent events, and multi-step outcomes. Use it as a probability tree diagram calculator for examples, exams, and real-world problems.
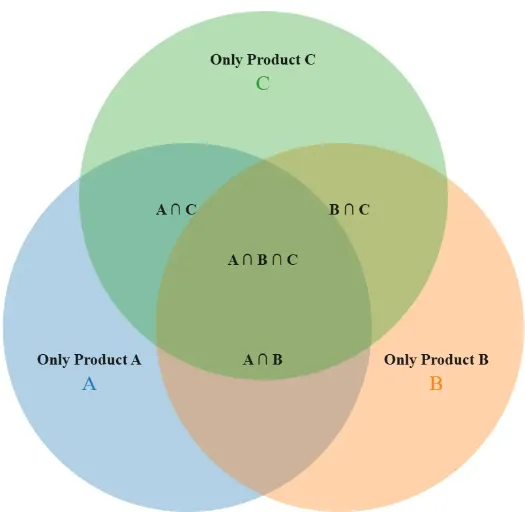
Venn Diagram Maker
Create Venn diagrams online with an easy-to-use Venn diagram maker. Generate 2, 3, 4, or more circle Venn diagrams for math, statistics, probability, and data visualization — free and online.
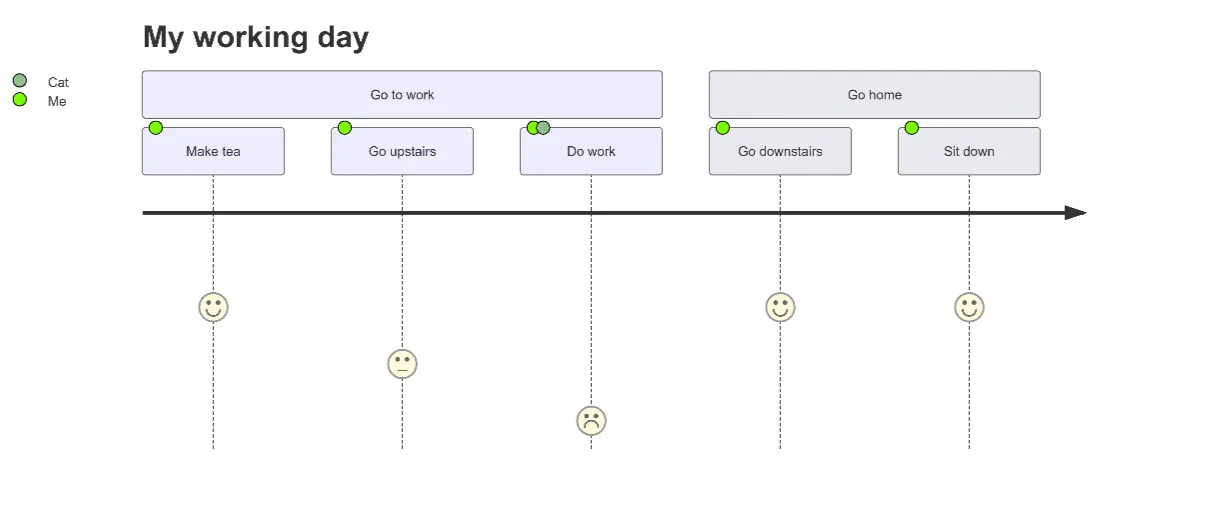
User Journey Map Maker
Generate clear, structured customer journey maps with AI. Visualize touchpoints, emotions, pain points, and satisfaction across the entire experience.