Create Feature Prioritization Matrices with AI
List your features and evaluation criteria—impact, effort, value, cost—and AI instantly generates a 2×2 or scored prioritization matrix to guide product decisions.
Try Feature Prioritization Matrix
Create your diagram instantly with AI. Describe what you need, and watch it come to life.
Quick examples (click to use):

Current selected: Quadrant Chart
Select a chart type and enter a description to generate a chart
Prioritize Features in 3 Steps
Transform complex decisions into a visual matrix
List Features & Criteria
Provide your features along with scores or qualitative ratings for impact, effort, risk, or value.
AI Builds the Matrix
AI creates a prioritization chart—Impact vs Effort, Value vs Cost, RICE, or any custom scoring model.
Decide What to Build
Use the matrix to identify high-impact, low-effort items and align your roadmap accordingly.
No signup required • No credit card needed • Make a free flow chart in seconds
Built for Product Teams
Make smarter decisions with data-backed visuals
- Impact vs Effort Matrix
- Identify quick wins, big bets, fill-ins, and time sinks with a classic 2×2 matrix.
- Value vs Cost
- Understand which investments create maximum customer or business value.
- RICE Scoring
- Use Reach, Impact, Confidence, and Effort to prioritize complex initiatives.
- Feature Comparison
- Compare dozens of ideas visually to uncover hidden opportunities.
Feature Prioritization FAQs
- Which prioritization model should I use?
Use Impact/Effort for simplicity, Value/Cost for business-oriented decisions, or RICE for detailed roadmap planning.
- How many features can I include?
A matrix is clearest with 10–20 features, but AI can visualize larger sets as well.
- Can I customize the axes?
Yes. Choose any two criteria—risk, urgency, cost, impact, satisfaction, effort—and AI will build the corresponding matrix.
- Can I generate multiple matrices?
Yes. Many teams compare multiple models before finalizing prioritization.
- Is this useful for leadership reviews?
Absolutely. Matrices simplify communication and reduce subjective debate.
Related Use Cases
Explore similar scenarios and expand your diagram creation possibilities
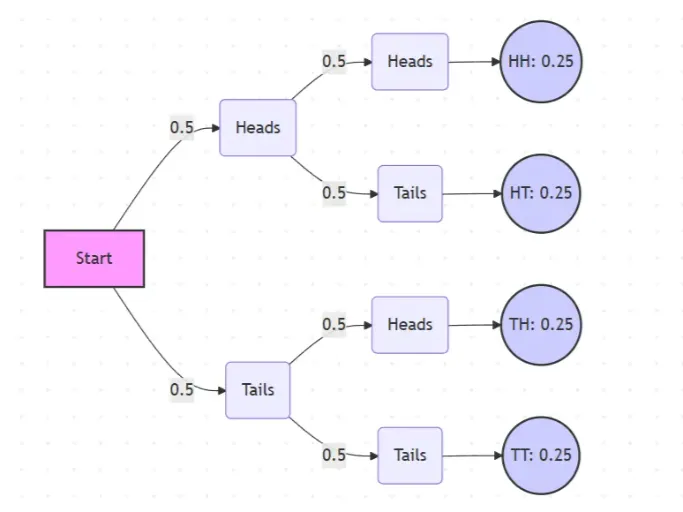
Probability Tree Diagram Generator
Create a probability tree diagram online to visualize conditional probability, dependent events, and multi-step outcomes. Use it as a probability tree diagram calculator for examples, exams, and real-world problems.
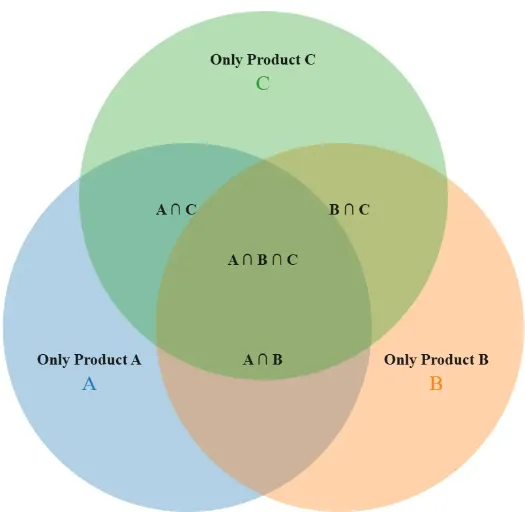
Venn Diagram Maker
Create Venn diagrams online with an easy-to-use Venn diagram maker. Generate 2, 3, 4, or more circle Venn diagrams for math, statistics, probability, and data visualization — free and online.
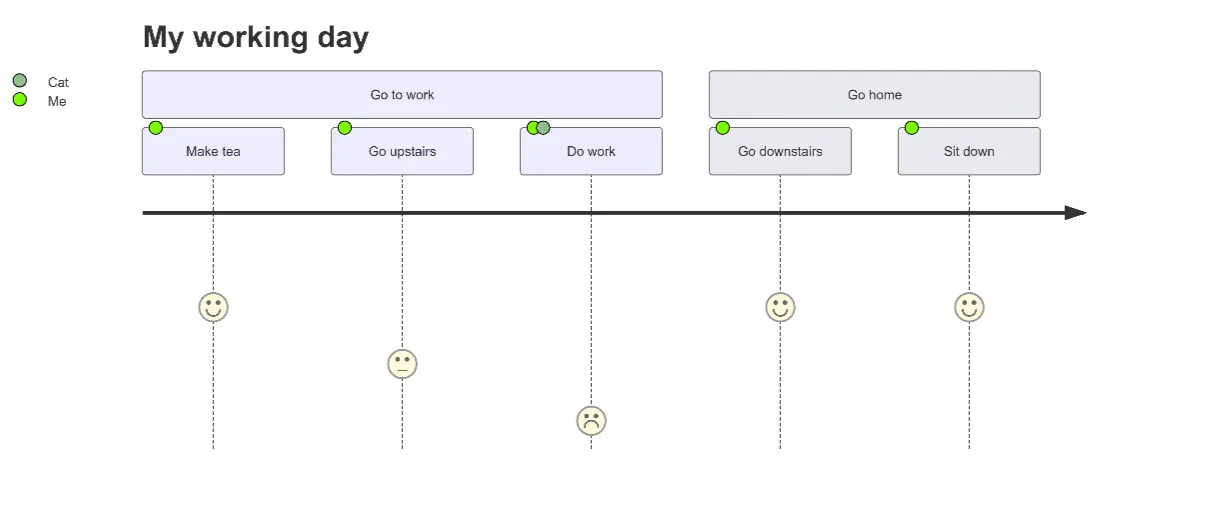
User Journey Map Maker
Generate clear, structured customer journey maps with AI. Visualize touchpoints, emotions, pain points, and satisfaction across the entire experience.