Create Pie Charts with AI
Explain your data distribution—market share, budgets, resource allocation—and AI instantly converts it into a professional pie chart with labeled segments and percentages.
Try Pie Chart Maker
Create your diagram instantly with AI. Describe what you need, and watch it come to life.
Quick examples (click to use):

Current selected: Pie Chart
Select a chart type and enter a description to generate a chart
Create Pie Charts in 3 Steps
From data input to presentation-ready visuals
Provide Data
List your categories and their values or percentages in plain text.
AI Generates Chart
AI creates a proportional pie chart with clean labels and segment colors.
Present Insights
Export the chart for reports, dashboards, slide decks, or stakeholder presentations.
No signup required • No credit card needed • Make a free flow chart in seconds
Pie Chart Features
Professional-grade visualization with zero manual design
- Automatic Percentages
- AI calculates percentages for each category—even when only raw values are provided.
- Clear Segmentation
- Colors and labels ensure distinct, readable categories.
- Market Analysis
- Ideal for competitive breakdowns, product mix, and demographic segmentation.
- Budget Visualization
- Show spending distribution for finance, planning, or presentations.
Pie Chart Maker FAQs
- What data works best for pie charts?
Any dataset where parts form a whole: market share, revenue segments, demographics, budget allocation, or product distribution.
- How many segments should I include?
For readability, keep 5–7 major segments. Combine small segments into an 'Other' category to avoid clutter.
- Can I use pie charts for time series data?
Pie charts visualize proportions at a single point in time. For trends, consider line or bar charts instead.
Related Use Cases
Explore similar scenarios and expand your diagram creation possibilities
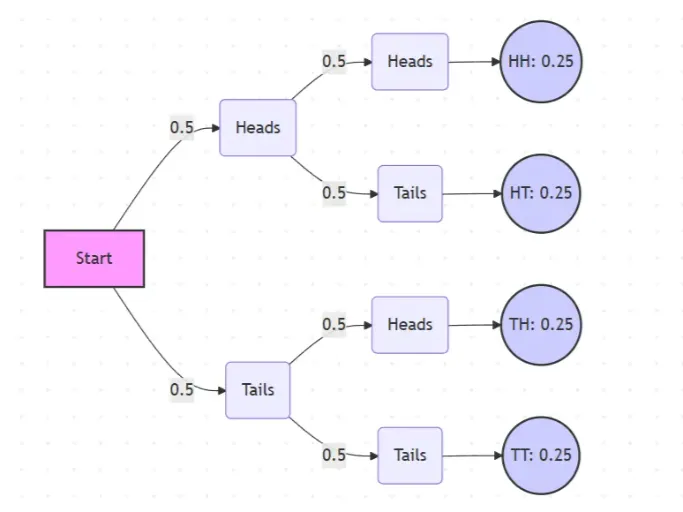
Probability Tree Diagram Generator
Create a probability tree diagram online to visualize conditional probability, dependent events, and multi-step outcomes. Use it as a probability tree diagram calculator for examples, exams, and real-world problems.
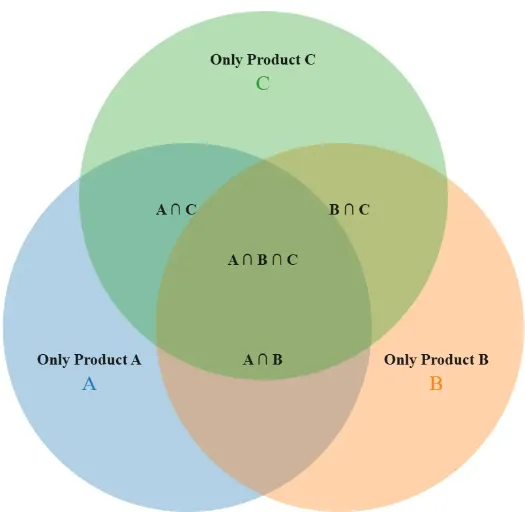
Venn Diagram Maker
Create Venn diagrams online with an easy-to-use Venn diagram maker. Generate 2, 3, 4, or more circle Venn diagrams for math, statistics, probability, and data visualization — free and online.
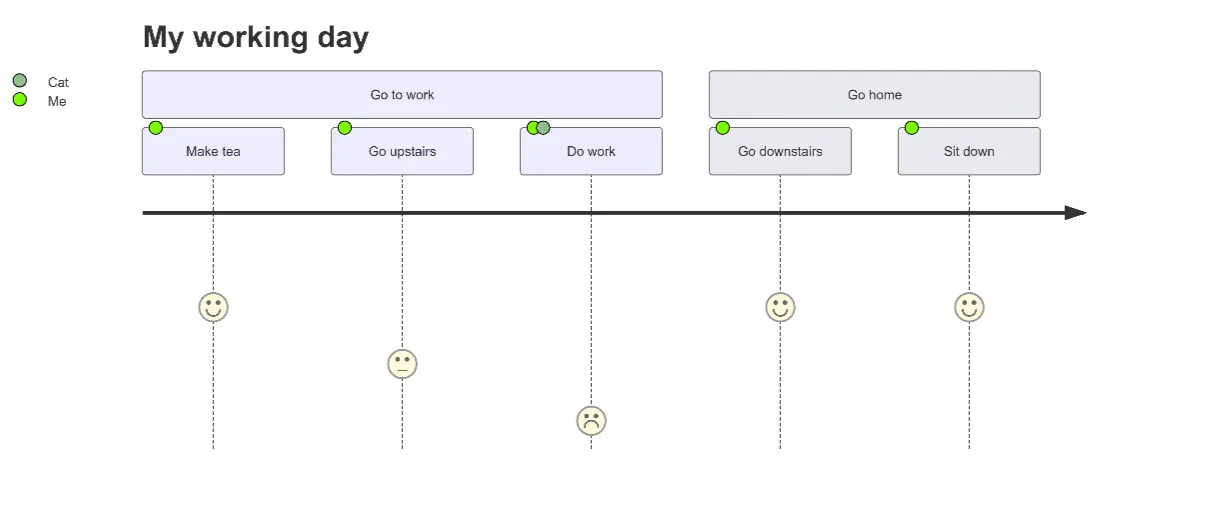
User Journey Map Maker
Generate clear, structured customer journey maps with AI. Visualize touchpoints, emotions, pain points, and satisfaction across the entire experience.