Create XY Charts with AI
Describe your data—sales numbers, growth metrics, comparisons, time-series trends—and AI instantly generates professional XY charts including lines, bars, or combined formats.
Try XY Chart Maker
Create your diagram instantly with AI. Describe what you need, and watch it come to life.
Quick examples (click to use):

Current selected: XY Chart
Select a chart type and enter a description to generate a chart
Create XY Charts in 3 Steps
From raw numbers to clear visual insights
Provide Data
List your X and Y values, categories, time periods, or multiple data series in plain text.
AI Generates Chart
AI produces a clean visualization using line charts, bar charts, or a hybrid combination depending on your data.
Present & Analyze
Use your chart for dashboards, reports, strategy reviews, or decision-making sessions.
No signup required • No credit card needed • Make a free flow chart in seconds
XY Chart Features
Transform complex datasets into easy-to-understand visuals
- Trend Analysis
- Plot time-based trends to reveal growth, decline, seasonal patterns, and performance shifts.
- Multiple Series Comparison
- Compare different KPIs or categories in a single chart for side-by-side evaluation.
- Sales Tracking
- Track revenue, quotas, product performance, or monthly progress visually.
- Flexible Chart Formats
- Choose line, bar, or mixed charts depending on your data and presentation needs.
XY Chart Maker FAQs
- What data can I visualize?
Any paired X/Y data such as sales trends, user growth, financial metrics, temperature readings, KPI comparisons, or time-series analytics.
- Can I show multiple data series?
Yes. You can visualize multiple sets of Y values across the same X-axis to compare results.
- Should I use bars or lines?
Use bars for categorical comparisons and lines for trend visualization. You can also combine both for hybrid charts.
Related Use Cases
Explore similar scenarios and expand your diagram creation possibilities
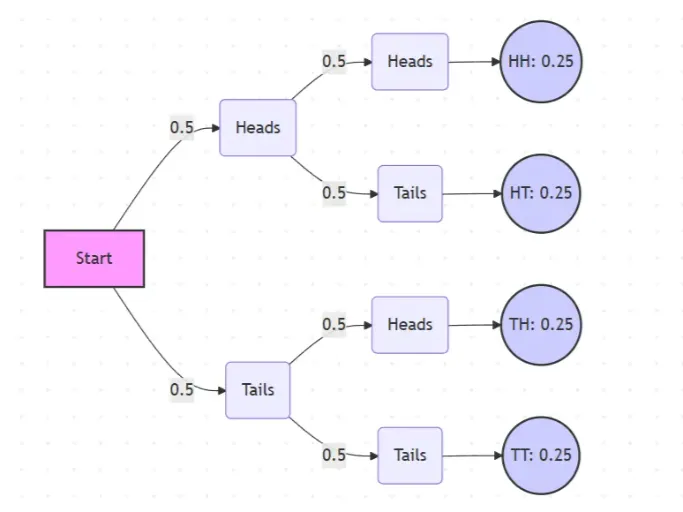
Probability Tree Diagram Generator
Create a probability tree diagram online to visualize conditional probability, dependent events, and multi-step outcomes. Use it as a probability tree diagram calculator for examples, exams, and real-world problems.
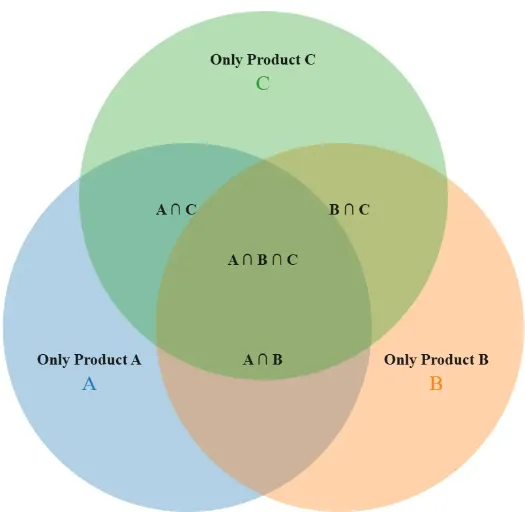
Venn Diagram Maker
Create Venn diagrams online with an easy-to-use Venn diagram maker. Generate 2, 3, 4, or more circle Venn diagrams for math, statistics, probability, and data visualization — free and online.
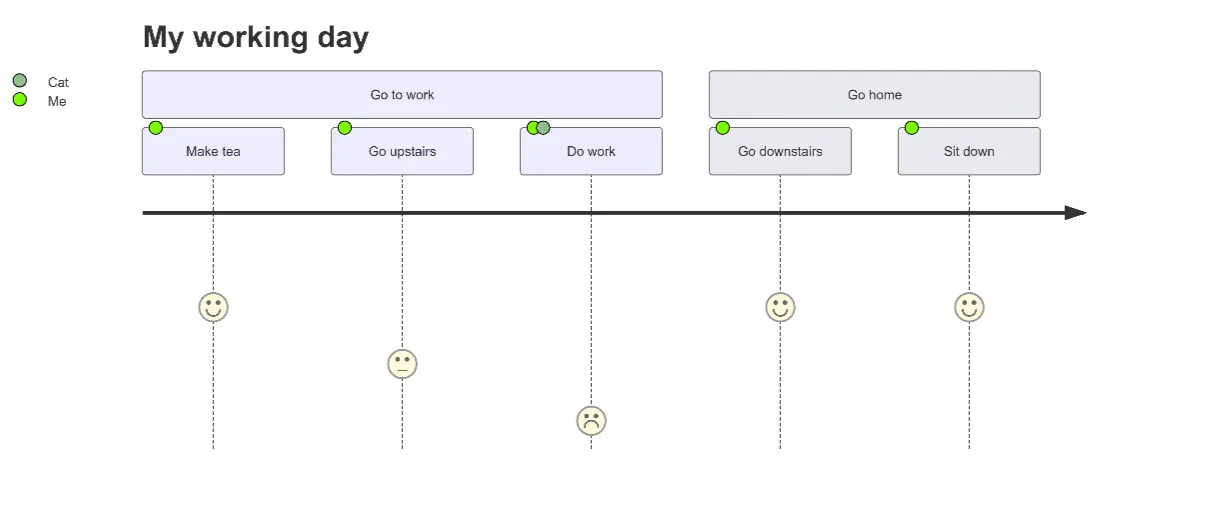
User Journey Map Maker
Generate clear, structured customer journey maps with AI. Visualize touchpoints, emotions, pain points, and satisfaction across the entire experience.