Create Company Timeline Diagrams with AI
List your company’s major events—founding, funding rounds, product launches, team growth—and AI converts them into a polished chronological timeline.
Try Company Milestones Timeline
Tạo sơ đồ ngay lập tức bằng AI. Chỉ cần nhập mô tả.
Ví dụ nhanh:

Current selected: Timeline
Chọn loại sơ đồ và nhập mô tả
Build Your Story in 3 Steps
Visualize key events from founding to present
List Key Events
Describe important milestones, achievements, partnerships, launches, and growth indicators.
AI Creates Timeline
AI arranges events chronologically to highlight progress and evolution.
Share Your Story
Export high-quality visuals for pitch decks, annual reports, websites, or investor presentations.
Không cần đăng ký • Không cần thẻ tín dụng • Tạo lưu đồ miễn phí trong vài giây
Storytelling Timeline Features
Elevate your narrative with clear visual structure
- Chronological Organization
- Events are placed on a clear timeline to highlight progression and growth.
- Multiple Events Per Period
- Support multiple milestones in the same quarter or year with visual grouping.
- Growth Trajectory
- Showcase company evolution across funding rounds, product releases, and team expansion.
- Funding Milestones
- Highlight investment rounds, valuations, and major financial achievements.
Company Timeline FAQs
- How far back should my timeline go?
Focus on milestones that matter to your narrative—founding, major pivots, product releases, key growth periods.
- What milestones are most impactful?
Founding, funding rounds, customer milestones, product launches, partnerships, awards, and expansion events.
- Can I include future milestones?
Yes. Add future plans or roadmap points, clearly labeled as upcoming.
- How do I make the timeline investor-ready?
Focus on metrics that validate traction—ARR, user growth, expansion, major contracts, and technical achievements.
- Can I mix product and corporate milestones?
Yes. Many companies combine these to tell a unified growth story.
Use-case liên quan
Khám phá các use-case tương tự
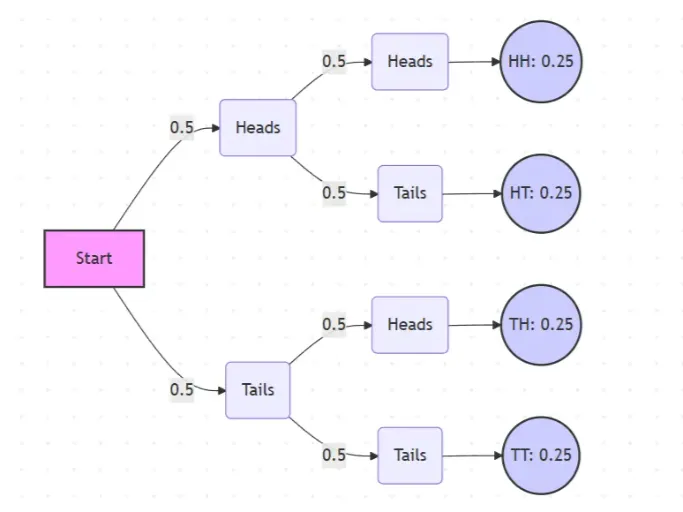
Probability Tree Diagram Generator
Create a probability tree diagram online to visualize conditional probability, dependent events, and multi-step outcomes. Use it as a probability tree diagram calculator for examples, exams, and real-world problems.
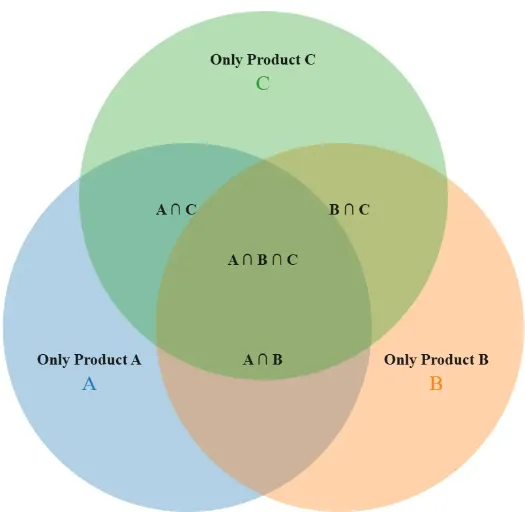
Venn Diagram Maker
Create Venn diagrams online with an easy-to-use Venn diagram maker. Generate 2, 3, 4, or more circle Venn diagrams for math, statistics, probability, and data visualization — free and online.
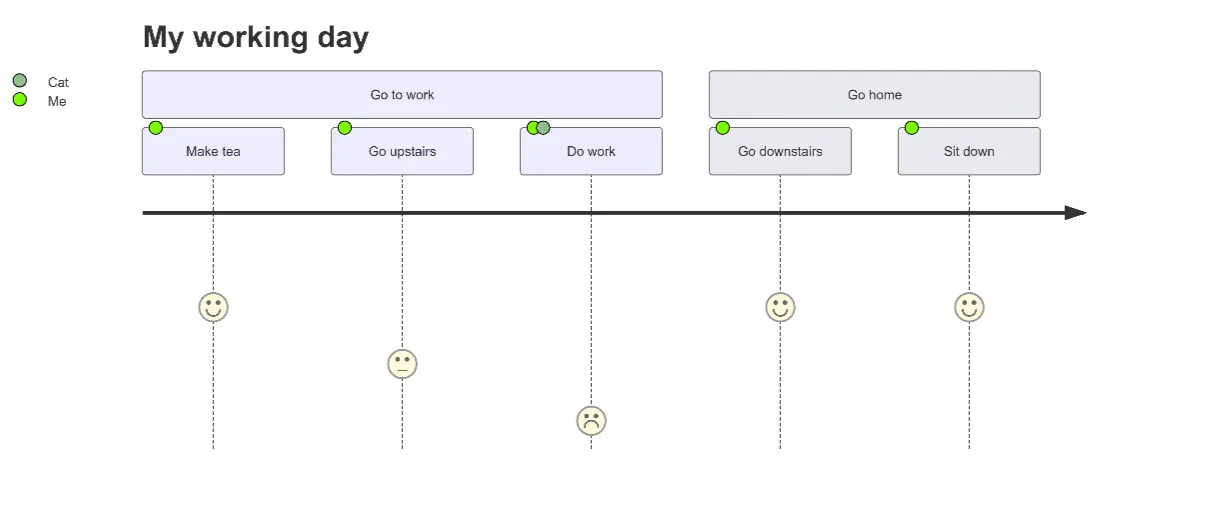
User Journey Map Maker
Generate clear, structured customer journey maps with AI. Visualize touchpoints, emotions, pain points, and satisfaction across the entire experience.