Create Quadrant Charts with AI
Describe your items and evaluation criteria, and AI instantly produces a 2×2 quadrant chart—perfect for prioritization, portfolio analysis, and strategic planning.
Try Quadrant Chart Maker
Tạo sơ đồ ngay lập tức bằng AI. Chỉ cần nhập mô tả.
Ví dụ nhanh:

Current selected: Quadrant Chart
Chọn loại sơ đồ và nhập mô tả
Create Quadrant Charts in 3 Steps
From decision criteria to strategic insights
Define Axes
Choose the two dimensions you want to analyze—for example: Impact/Effort, Value/Cost, Risk/Reward, or Urgency/Importance.
Plot Items
List your items and assign each one a position along both axes. AI maps them into the appropriate quadrant.
Make Decisions
Use the resulting chart to prioritize, allocate resources, or identify high-value opportunities.
Không cần đăng ký • Không cần thẻ tín dụng • Tạo lưu đồ miễn phí trong vài giây
Quadrant Chart Features
A strategic tool for product and business decisions
- Eisenhower Matrix
- Visualize urgency vs. importance to plan tasks and responsibilities.
- Value vs Effort
- Quickly identify low-effort, high-impact opportunities and deprioritize low-value work.
- Risk Assessment
- Plot risks by probability and impact to highlight areas requiring mitigation.
- Portfolio Analysis
- Evaluate products, features, investments, or opportunities through a 2×2 strategic lens.
Quadrant Chart Maker FAQs
- Which frameworks work well with quadrant charts?
Eisenhower Matrix, Value/Effort, Impact/Feasibility, RICE scoring, Risk Matrix, BCG Matrix, and many more strategic decision models.
- How do I score items objectively?
Use real metrics whenever possible—customer demand, revenue potential, engineering effort, or impact scores. For subjective items, scoring rubrics or team voting works well.
- What if I have too many items?
Prioritize the top 10–20 items or create themed versions of the quadrant (e.g., by team or category). Overcrowded charts reduce clarity.
Use-case liên quan
Khám phá các use-case tương tự
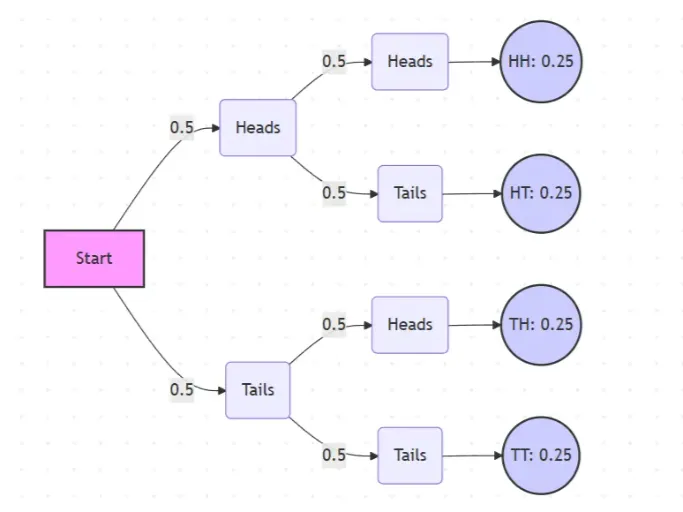
Probability Tree Diagram Generator
Create a probability tree diagram online to visualize conditional probability, dependent events, and multi-step outcomes. Use it as a probability tree diagram calculator for examples, exams, and real-world problems.
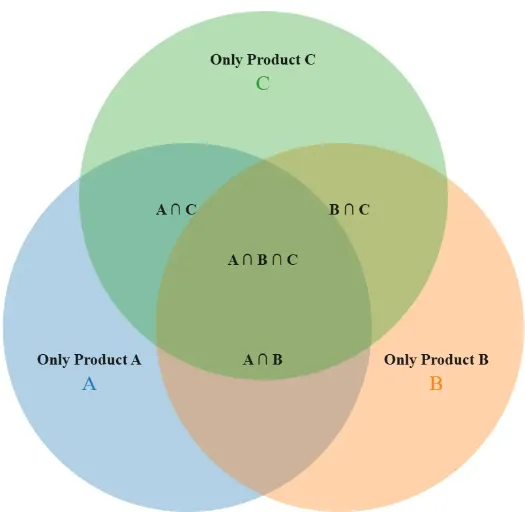
Venn Diagram Maker
Create Venn diagrams online with an easy-to-use Venn diagram maker. Generate 2, 3, 4, or more circle Venn diagrams for math, statistics, probability, and data visualization — free and online.
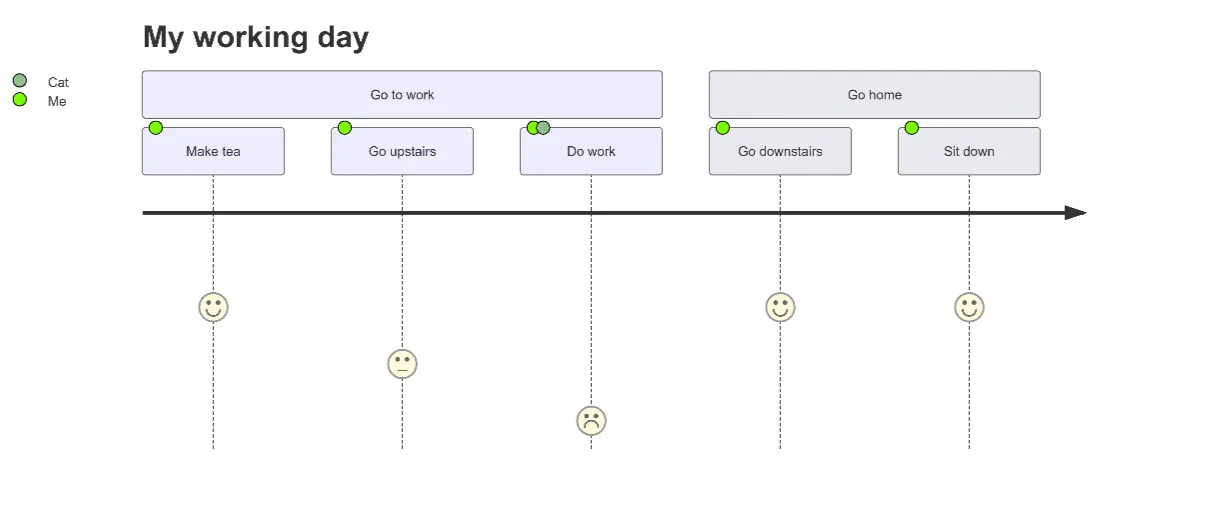
User Journey Map Maker
Generate clear, structured customer journey maps with AI. Visualize touchpoints, emotions, pain points, and satisfaction across the entire experience.