Create Sankey Diagrams with AI
Describe your flow data—website traffic, budget allocation, funnel conversions, or energy distribution—and AI builds a proportional Sankey diagram showing how values move across stages.
Try Sankey Diagram Maker
Tạo sơ đồ ngay lập tức bằng AI. Chỉ cần nhập mô tả.
Ví dụ nhanh:

Current selected: Sankey
Chọn loại sơ đồ và nhập mô tả
Create Sankey Diagrams in 3 Steps
From flow description to proportional visualization
Describe Flows
List sources, destinations, and flow magnitudes between stages or nodes.
AI Generates Diagram
AI constructs a Sankey diagram with accurate flow widths representing volume distribution.
Analyze Patterns
Use the visualization to identify bottlenecks, drop-offs, inefficiencies, or high-impact pathways.
Không cần đăng ký • Không cần thẻ tín dụng • Tạo lưu đồ miễn phí trong vài giây
Sankey Diagram Features
Visualize complex flows with intuitive clarity
- Proportional Flow Widths
- Flow thickness automatically reflects the magnitude of each transfer.
- Traffic Analysis
- Visualize user movement across landing pages, funnels, or multi-step journeys.
- Budget Tracking
- Show how funds are allocated across departments, stages, or initiatives.
- Energy & Resource Distribution
- Map energy, material, or resource flows within complex systems.
Sankey Diagram Maker FAQs
- What data works best in Sankey diagrams?
Any process involving movement from one state to another: website traffic, user funnels, budget allocation, manufacturing flows, energy usage, supply chains, etc.
- Can I show multi-step flows?
Yes. Describe flows across multiple stages and AI will build a multi-level Sankey diagram.
- How do I handle split or merged flows?
Just describe how a quantity divides or converges, and AI will map it proportionally in the diagram.
Use-case liên quan
Khám phá các use-case tương tự
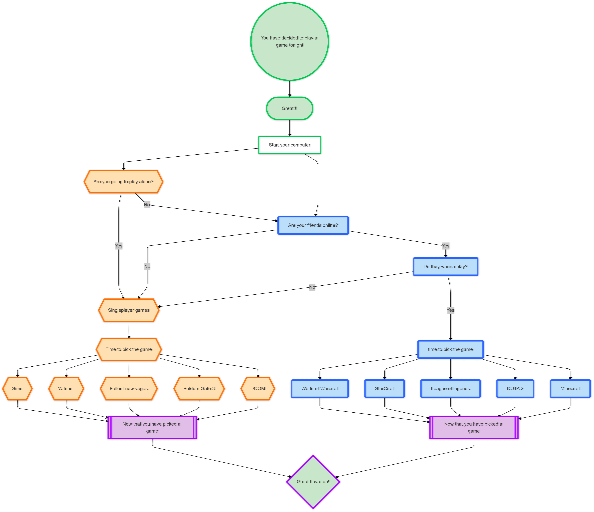
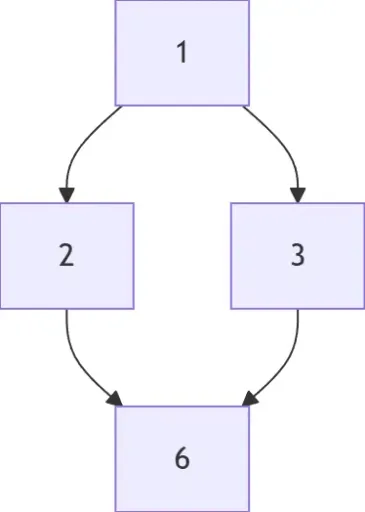
Flowchart Maker
Generate clean, editable flowcharts with AI. Describe any process in plain text and instantly turn it into a structured, professional diagram.
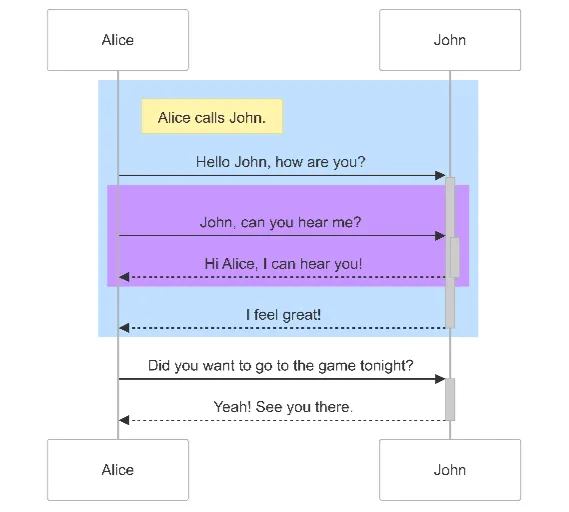
Sequence Diagram Maker
Generate UML sequence diagrams with AI to visualize how components, services, or systems interact over time.
Hasse Diagram Generator
Generate Hasse diagrams from any partially ordered set (poset). Perfect for mathematics, discrete structures, logic, and computer science.