Create Market Share Pie Charts with AI
Provide your category values or percentages and AI instantly generates a clean, accurate pie chart to visualize market share, product mix, or business segmentation.
Try Market Share Analysis
Diyagramınızı hemen oluşturun. Ne istediğinizi yazın.
Hızlı örnekler:

Current selected: Pie Chart
Diyagram türü seçin ve bir açıklama girin
Visualize Data in 3 Steps
Turn raw numbers into strategic insights
Provide Your Data
List segments, values, or percentage shares for your market categories.
AI Creates Pie Chart
AI generates a proportional pie chart with color-coded segments and labels.
Present Insights
Export your chart for pitch decks, dashboards, reports, or competitor analysis.
Kayıt gerekmez · Kredi kartı gerekmez · Saniyeler içinde ücretsiz akış şeması
Business Intelligence Features
Communicate market positioning with precision
- Market Segmentation
- Visualize how your market is distributed across competitors, categories, or demographics.
- Percentage Display
- AI automatically calculates and displays segment percentages—even with raw input values.
- Competitive Analysis
- Quickly compare your share against competitors to identify strengths and gaps.
- Revenue Breakdown
- Show revenue contributions across regions, customer profiles, or product lines.
Market Share Analysis FAQs
- What types of business data work best in pie charts?
Market share, budget allocation, product mix, demographic distribution, and any dataset where the components add to a meaningful whole.
- How many segments should I include?
Limit to 5–7 major segments for readability. Use an 'Other' category for small slices.
- Can I compare pie charts over time?
Yes. Create multiple pie charts for different periods to visualize shifting market dynamics.
- How do I handle very small percentages?
Group small slices together or switch to a bar chart for improved clarity.
- Should I use 2D or 3D charts?
2D charts are recommended—they avoid distortion and communicate proportions more accurately.
İlgili kullanım senaryoları
Benzer diyagramları keşfedin
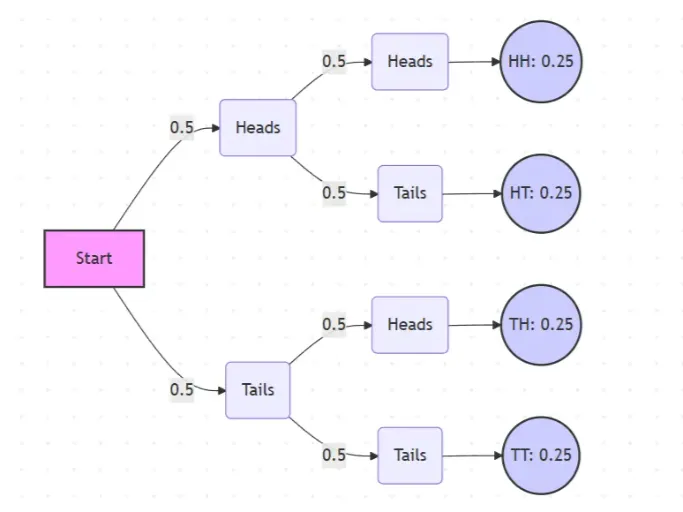
Probability Tree Diagram Generator
Create a probability tree diagram online to visualize conditional probability, dependent events, and multi-step outcomes. Use it as a probability tree diagram calculator for examples, exams, and real-world problems.
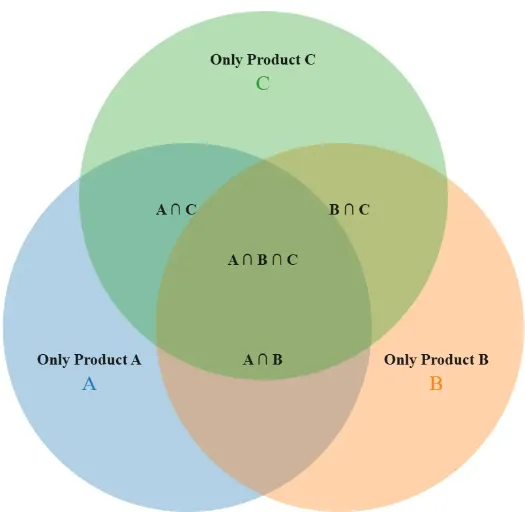
Venn Diagram Maker
Create Venn diagrams online with an easy-to-use Venn diagram maker. Generate 2, 3, 4, or more circle Venn diagrams for math, statistics, probability, and data visualization — free and online.
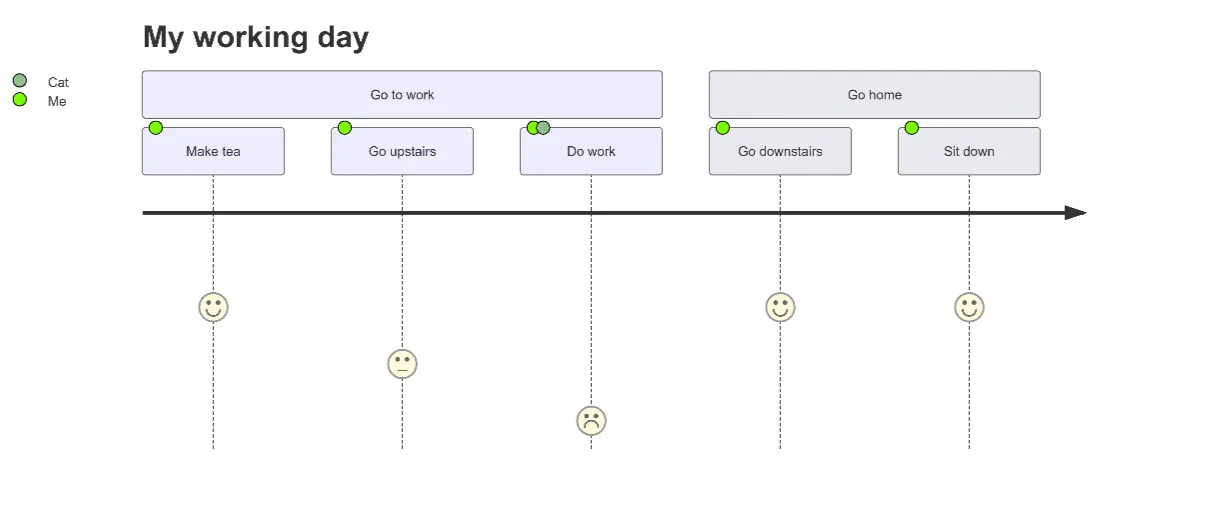
User Journey Map Maker
Generate clear, structured customer journey maps with AI. Visualize touchpoints, emotions, pain points, and satisfaction across the entire experience.