Create User Onboarding State Diagrams with AI
Describe your onboarding journey—registration, profile completion, verification, activation milestones—and AI converts it into a structured state machine diagram.
Try User Onboarding States
Diyagramınızı hemen oluşturun. Ne istediğinizi yazın.
Hızlı örnekler:

Current selected: State Diagram
Diyagram türü seçin ve bir açıklama girin
Design Onboarding in 3 Steps
Make user activation paths clear and measurable
Map Onboarding Steps
List the stages users go through—signup, verification, tutorials, feature discovery, activation.
AI Builds State Machine
AI generates a diagram showing onboarding progress, completion states, branching paths, and fallback scenarios.
Optimize Conversion
Identify friction points, drop-off states, and opportunities to shorten time-to-value.
Kayıt gerekmez · Kredi kartı gerekmez · Saniyeler içinde ücretsiz akış şeması
User Activation Features
Visualize how users progress toward meaningful activation
- Multi-Step Onboarding
- Model onboarding sequences that span multiple steps, screens, or tasks.
- Verification Workflows
- Include email, phone, KYC, or identity verification states.
- Feature Discovery
- Show tutorial flows, guided tours, or progressive feature unlocks.
- Activation Triggers
- Highlight key moments where users experience value for the first time.
User Onboarding State FAQs
- How do I model optional vs required onboarding steps?
Specify which actions are mandatory and which are optional. AI will differentiate required flows from secondary enhancement paths.
- Can I show different paths for different user types?
Yes. AI supports branching logic for user roles, subscription levels, goals, or personas.
- How do I handle onboarding that spans multiple sessions?
Include persistent states such as 'in_progress' and describe resume logic for returning users.
- Can I add post-onboarding engagement states?
Yes. Extend your diagram with states like 'exploring_features', 'active_user', 'at_risk', etc.
- How do I optimize conversion based on the state machine?
Identify states with high exit transitions and reorganize steps to shorten and simplify the path to activation.
İlgili kullanım senaryoları
Benzer diyagramları keşfedin
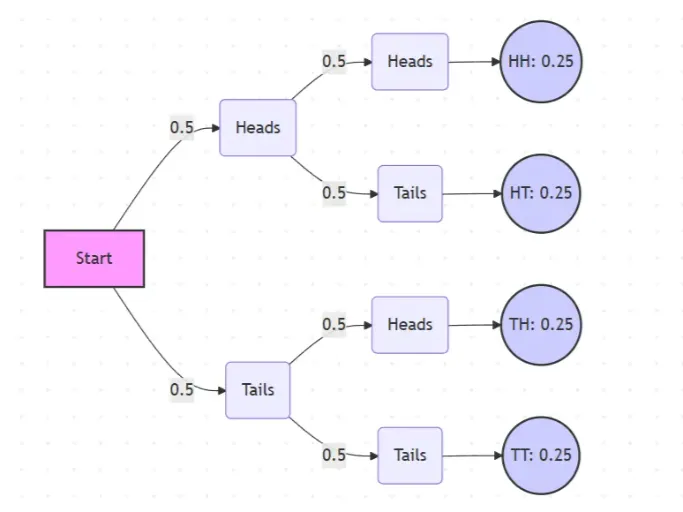
Probability Tree Diagram Generator
Create a probability tree diagram online to visualize conditional probability, dependent events, and multi-step outcomes. Use it as a probability tree diagram calculator for examples, exams, and real-world problems.
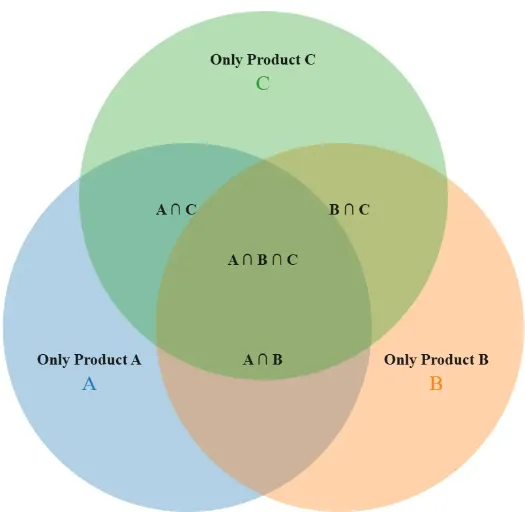
Venn Diagram Maker
Create Venn diagrams online with an easy-to-use Venn diagram maker. Generate 2, 3, 4, or more circle Venn diagrams for math, statistics, probability, and data visualization — free and online.
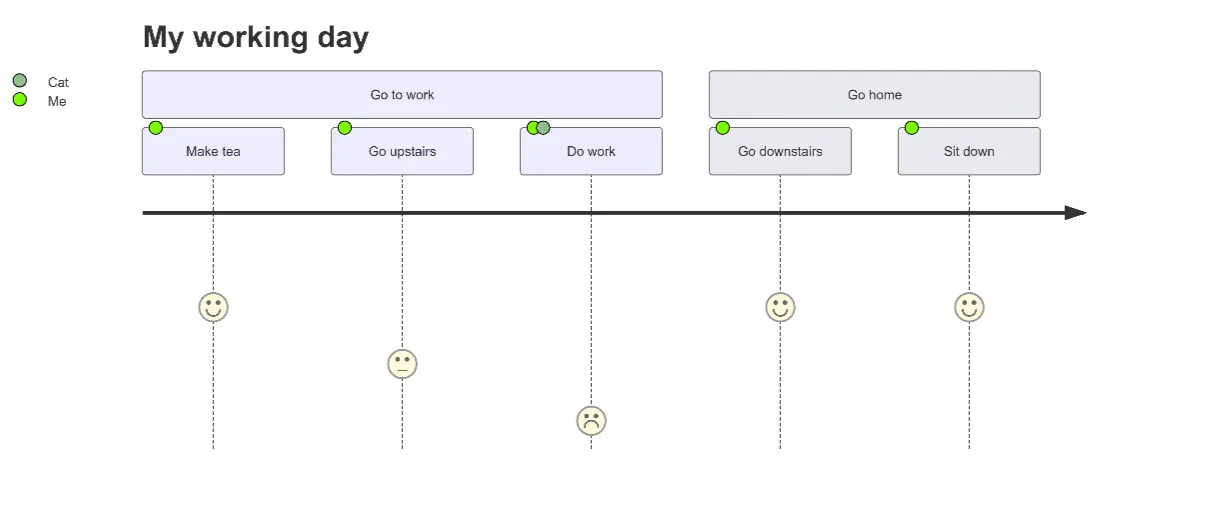
User Journey Map Maker
Generate clear, structured customer journey maps with AI. Visualize touchpoints, emotions, pain points, and satisfaction across the entire experience.